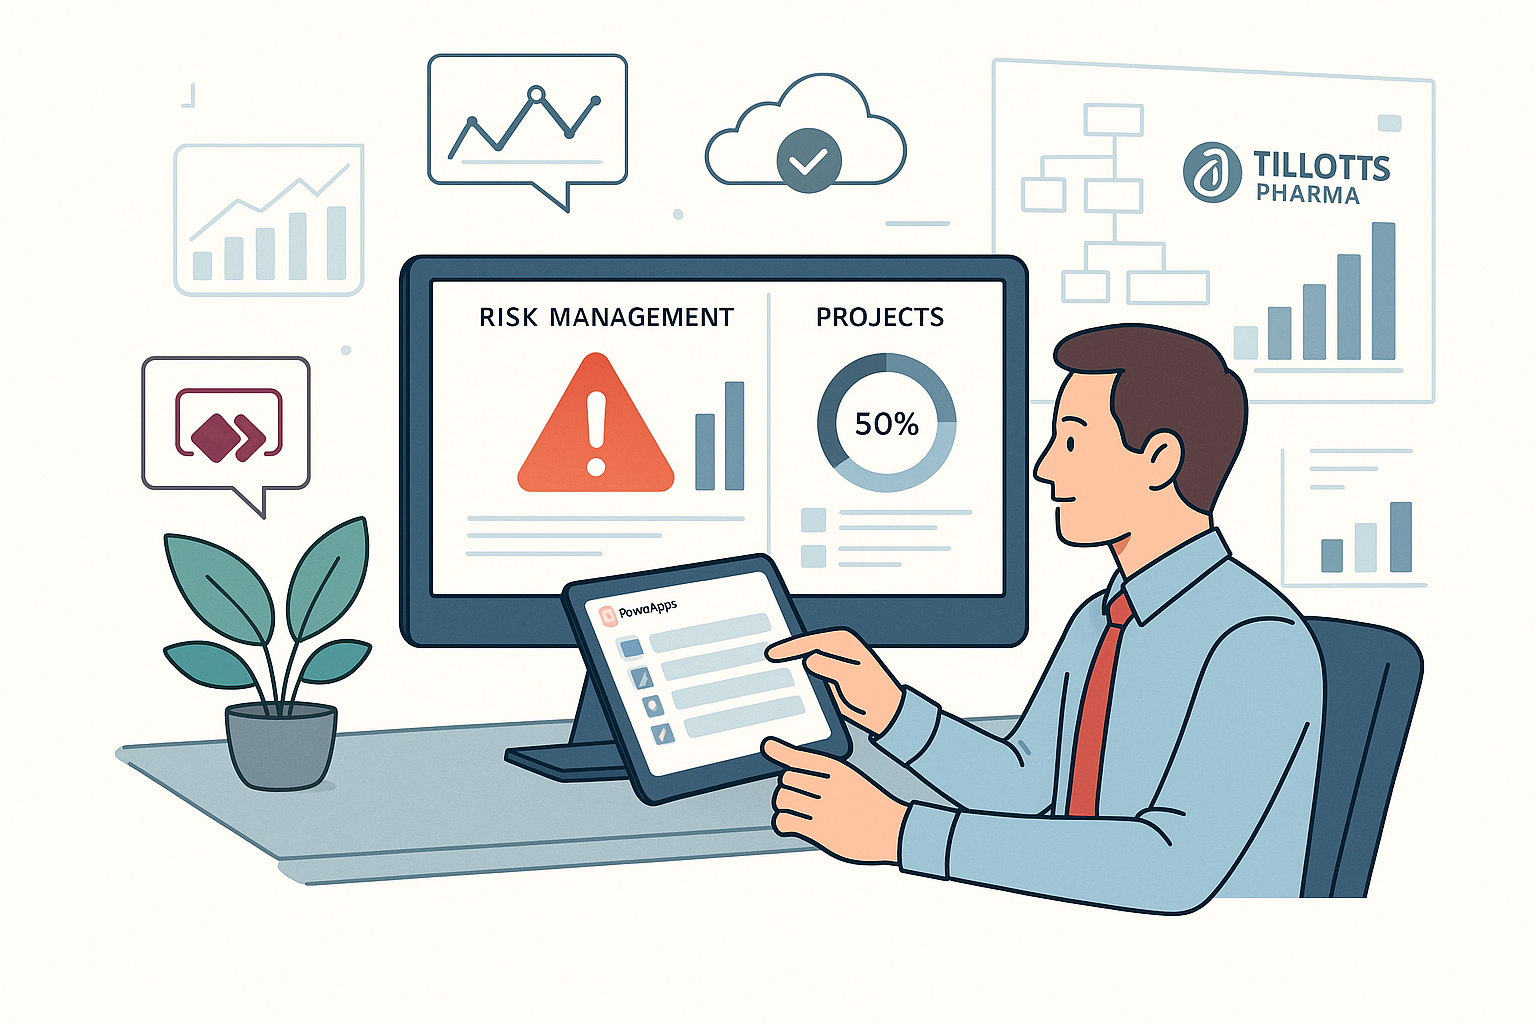
The Risk Management Challenge in Pharma
Tillotts Pharma, a specialty pharmaceutical company focused on gastroenterology, faced challenges common across regulated industries: critical risk and project management data trapped in spreadsheets, email chains, and disconnected systems. Project managers spent hours compiling status reports manually. Risk assessments happened in isolation. Leadership lacked real-time visibility into potential issues.
In pharmaceuticals, where regulatory compliance is paramount and project delays cost millions, this visibility gap created serious business risk. By the time issues appeared in monthly reports, opportunities for proactive intervention had often passed.
The Traditional Approach and Its Limitations
Like many pharmaceutical companies, Tillotts managed projects and risks through a combination of Excel spreadsheets, SharePoint document libraries, and periodic status meetings. Project managers maintained their own tracking systems. Risk registers lived in static documents. Aggregating information for executive reporting required manual data gathering across multiple sources.
This approach created several problems:
Delayed Visibility: Leadership discovered issues weeks after they emerged, when intervention options were limited.
Inconsistent Data: Each project manager used slightly different templates and tracking methods, making cross-project analysis difficult.
Manual Overhead: Significant time spent on data compilation rather than actual project management and risk mitigation.
Limited Analytics: Historical data trapped in spreadsheets provided little insight into patterns or trends that could inform future projects.
The PowerApps Solution Design
We worked with Tillotts to design a custom PowerApps solution that transformed risk and project management from reactive to proactive:
Centralized Project and Risk Database
Built on SharePoint with Power Apps front-ends, the solution created a single source of truth for all project and risk data. Project managers input information once, in standardized formats, accessible instantly across the organization.
Real-Time Dashboards
Power BI dashboards provided leadership with instant visibility into project health, risk exposure, and resource allocation. Rather than waiting for monthly reports, executives accessed current data on demand.
Automated Workflows
Power Automate workflows handled routine tasks automatically: escalating high-priority risks, notifying stakeholders of project milestones, reminding owners of pending risk assessments, and triggering reviews when projects deviated from baseline.
Mobile Access
Project managers and executives accessed the system from any device, enabling quick updates and decision-making regardless of location—critical in pharmaceutical environments where leaders travel frequently between facilities and conferences.
Implementation Approach
Phase 1: Requirements and Design (Weeks 1-2)
We conducted workshops with project managers, risk officers, and executive stakeholders to understand current processes, pain points, and requirements. Rather than digitizing existing spreadsheets blindly, we identified opportunities to improve underlying processes.
Key decisions made during design:
- Standardized risk categories and severity scales
- Defined project stage gates and approval workflows
- Established escalation criteria and notification rules
- Determined which historical data to migrate vs. archive
Phase 2: Development and Testing (Weeks 3-6)
We built the Power Apps solution iteratively, delivering functional increments every two weeks for user feedback. This agile approach ensured the system met actual needs rather than assumed requirements.
The development incorporated pharmaceutical industry best practices:
- Audit trails tracking all changes for regulatory compliance
- Role-based security ensuring proper data access controls
- Validation rules preventing data quality issues
- Integration with existing SharePoint document libraries for project artifacts
Phase 3: Pilot and Refinement (Weeks 7-8)
We piloted with three projects representing different types and complexities. Project managers used the system in parallel with existing approaches, providing feedback on usability and functionality. Based on pilot learning, we refined interfaces, adjusted workflows, and enhanced reporting.
Phase 4: Rollout and Training (Weeks 9-10)
Full organizational rollout included comprehensive training for all users: hands-on sessions for project managers, executive briefings on dashboard capabilities, and admin training for IT support staff. We provided detailed documentation and quick-reference guides.
Results and Business Impact
Operational Efficiency
80% Reduction in Manual Reporting Time: Project managers spent hours weekly compiling status reports. Automated data aggregation eliminated this burden, freeing time for actual project management.
50% Faster Project Status Updates: Real-time data access meant stakeholders had current information instantly rather than waiting for scheduled reports.
Elimination of Data Entry Duplication: Information entered once flowed to all relevant reports and dashboards automatically.
Risk Management Improvements
Proactive Risk Identification: Systematic risk tracking revealed issues early when mitigation options were most effective.
Complete Risk Visibility: Leadership saw aggregate risk exposure across all projects, enabling better resource allocation and prioritization.
Audit-Ready Documentation: Regulatory inspections require comprehensive documentation of risk management processes. The system provided complete, auditable records automatically.
Strategic Decision-Making
Data-Driven Resource Allocation: Analytics showing which projects consumed most resources informed strategic planning and portfolio management.
Historical Learning: Ability to analyze past projects helped refine estimation, risk assessment, and planning for future initiatives.
Executive Confidence: Real-time visibility enabled faster, better-informed decisions on project investments and risk mitigation strategies.
Technical Architecture
The solution leveraged Microsoft Power Platform and SharePoint:
Data Layer: SharePoint lists storing project and risk data with proper security and version control.
Application Layer: Power Apps providing intuitive interfaces for data entry and management.
Automation Layer: Power Automate workflows handling notifications, escalations, and routine tasks.
Analytics Layer: Power BI embedded dashboards providing real-time insights and historical analysis.
Integration Layer: Connections to existing SharePoint document libraries and Office 365 for seamless workflow integration.
Change Management Success Factors
Technology implementation succeeds or fails based on user adoption. Several factors drove Tillotts success:
Executive Sponsorship: Visible leadership support signaled organizational commitment and importance.
User Involvement: Project managers participated in design from day one, ensuring the system met actual needs.
Incremental Rollout: Pilot program built confidence and demonstrated value before full deployment.
Comprehensive Training: Hands-on sessions ensured users felt comfortable with new tools.
Ongoing Support: Dedicated support during initial weeks addressed issues quickly, preventing frustration.
Lessons Learned
Several insights emerged from this implementation:
Process First, Technology Second: We improved underlying processes before automating them. Digitizing broken processes just creates digital problems.
Start Simple, Iterate: Initial release focused on core functionality. Advanced features added based on user feedback after adoption.
Mobile Matters: Even in office environments, mobile access proved valuable for executives and traveling staff.
Integration Is Key: Connecting to existing SharePoint libraries and Office 365 made the system feel like natural workflow extension rather than separate tool.
Data Quality Foundation: Standardized data entry templates and validation rules prevented quality issues that undermine analytics value.
Applicability Beyond Pharmaceuticals
While built for pharma, this approach applies anywhere complex projects and risks require management:
- Manufacturing companies managing product development and quality risks
- Financial institutions tracking regulatory compliance and operational risks
- Healthcare organizations managing clinical quality and safety projects
- Government agencies coordinating multi-department initiatives
The core pattern—centralized data, real-time visibility, automated workflows, mobile access—delivers value across industries.
Getting Started
If your organization struggles with project and risk management visibility—relying on spreadsheets and manual reporting, discovering issues too late, spending excessive time on status compilation—there is a better path forward.
Ready to transform your project and risk management? Contact QueryNow for a Power Apps opportunity assessment. We will evaluate your current processes, identify improvement opportunities, and provide a roadmap for implementing modern project and risk management capabilities tailored to your industry and regulatory requirements.


